Table of Contents
Part One:- LTNs come with a price. A price which has to be paid by everyone who doesn't live in one.
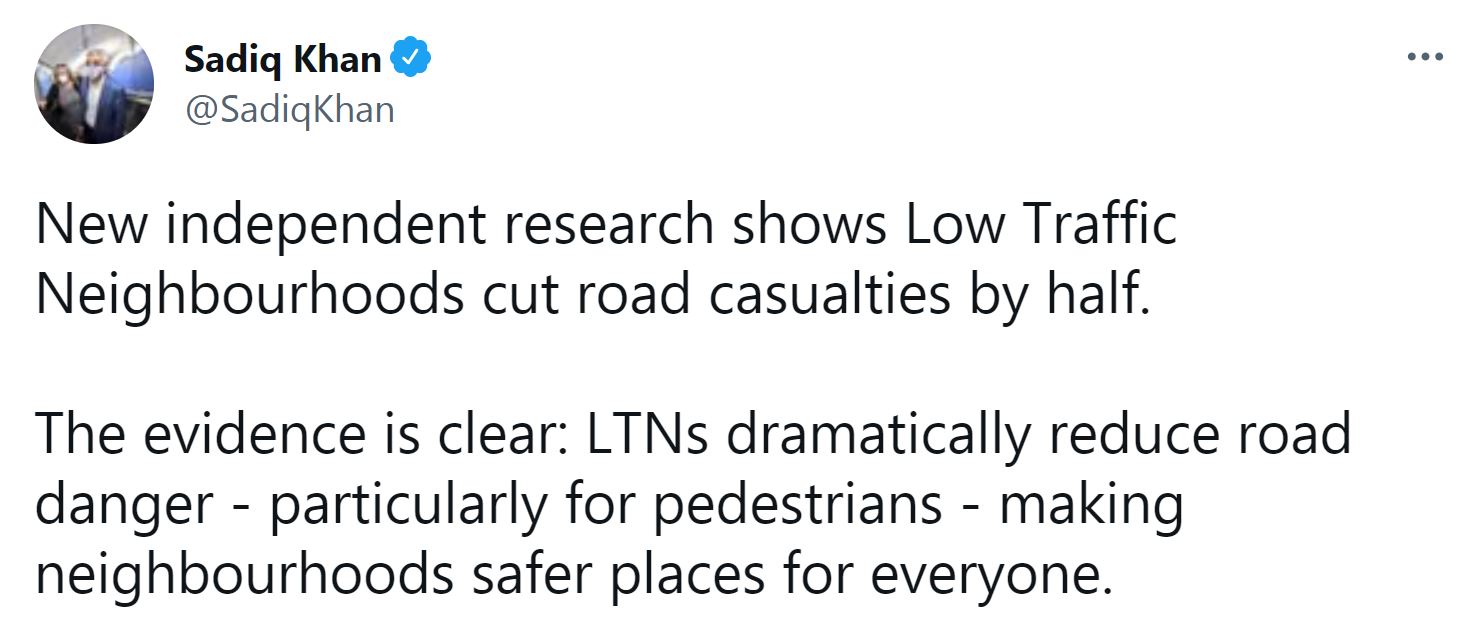
They say in times of war the first casualty is always the truth, and there can be no denying Sadiq Kahn, London’s Lord Mayor, is smack bang in the middle of a propaganda blitzkreig at the moment.
For those who are unaware, during 2020 a LOT of two-way streets in London were converted into long single-entry cul-de-sacs. At the time, London’s road system was experiencing at least 35% fewer vehicles due to all the mandatory COVID-19 lockdowns so the full effect of this “social engineering experiment by stealth” was not immediately obvious.
However, a recent traffic study published by Anna Goodman and Dr Rachel Aldred in July 2021 claims London’s controversial Low Traffic Neighbourhoods have reduced road injury incidents by up to 50% within London’s LTNs. The research, which you can read by clicking here, makes some rather dubious conclusions based on a comparison of road injury incidents in Q4 of 2020 compared to the same period in 2018 and 2019.
According to Goodman and Aldred, London’s Low Traffic Neighbourhoods consumed 4% of London’s road system during the COVID lockdowns of 2020. Clearly, that’s 4% of London’s road system which is no longer usable to the greater public. In a city which was already desperately short of usable road space, the net result has been excruciating for people trying to get to and from work.
Well here’s the problem. The evidence is NOT clear – far from it. Setting aside the typical political spin most politicians tend to use nowadays, the reality is the reduced incident rates which are quoted in the Goodman report had far more to do with COVID lockdowns than they did with anything else.
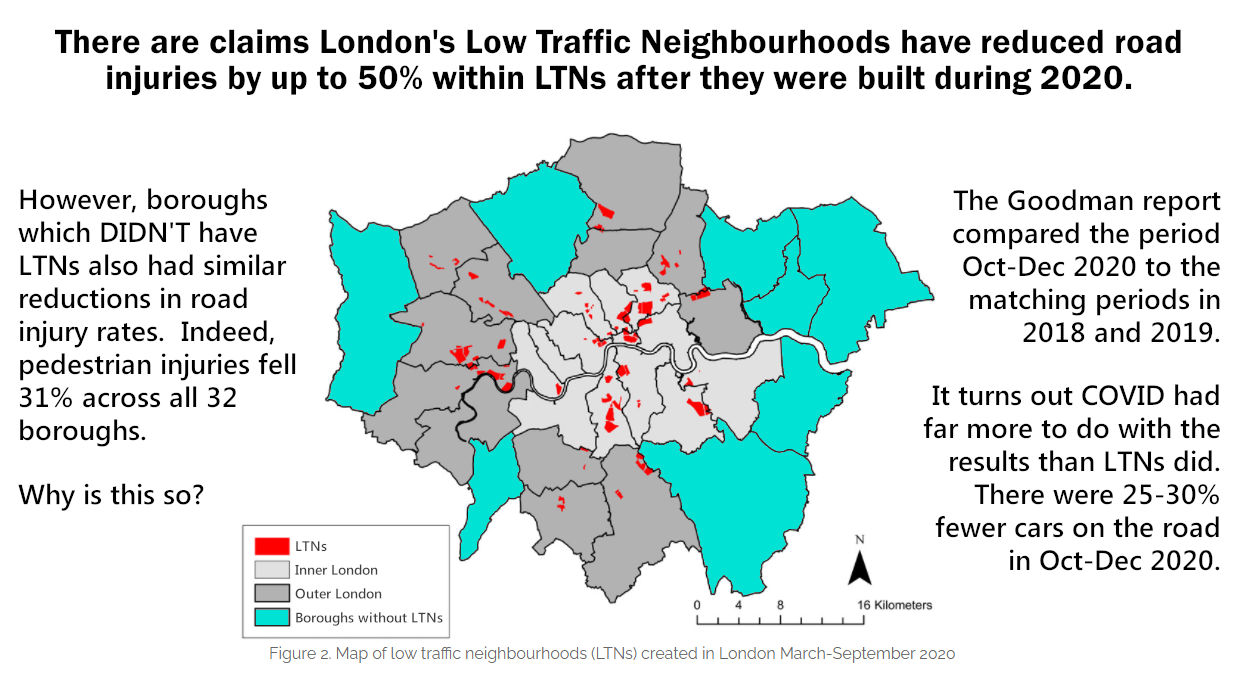
According to Goodman and Aldred, Low Traffic Neighbourhoods are the ONLY reason road injuries dropped in Q4 of 2020. If that's true, why did the boroughs which DIDN'T introduce LTNs in 2020 also experience a 28% drop in pedestrian injuries across all 10 non LTN boroughs during the same time frame?
Geoff Baird, Single File Please
Part Two:- The Goodman Study tells people what the Mayor wants them to hear.
There’s a common trap some researchers fall into when using statistics. Namely, they tend to settle on a theory first and then cherry pick statistics to prove their theory later. Put another way, it’s a way of making a square peg fit in a round hole.
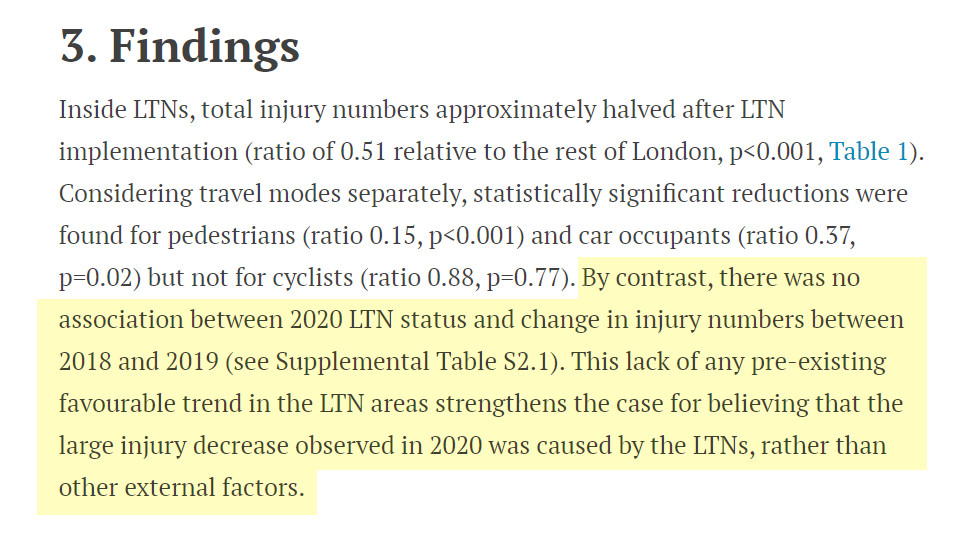
In this screenshot from the July 2021 Goodman Study, it’s worth noting the very last sentence. “The large injury decrease observed in 2020 was caused by the LTNs, rather than other external factors.” That’s a very dangerous premise to operate under because, right from the word go, the study clearly ruled out legitimate “external factors” such as 25% fewer cars were on the road during the 4th quarter of 2020 due to COVID lockdowns. Indeed, the Goodman Study conspicuously downplayed the reduction in car traffic during Q4, and it did so in an effort to amplify the validity of it’s false conclusions.
But also, the Goodman Study chose to ignore the fact there were simply fewer people walking on the streets during Q4 in 2020 – again, due to COVID lockdowns. By their own admission, no less than 70% of all the road injuries which were included in their BEFORE data were “slight injuries” with no motor vehicle involved – equivalent to someone tripping over a kerb and scraping their knee due to uneven pavement. Clearly, fewer people walking on the streets meant fewer people accidentally scraping their knees.
Let’s take a moment to study the data contained in the Goodman report shall we?
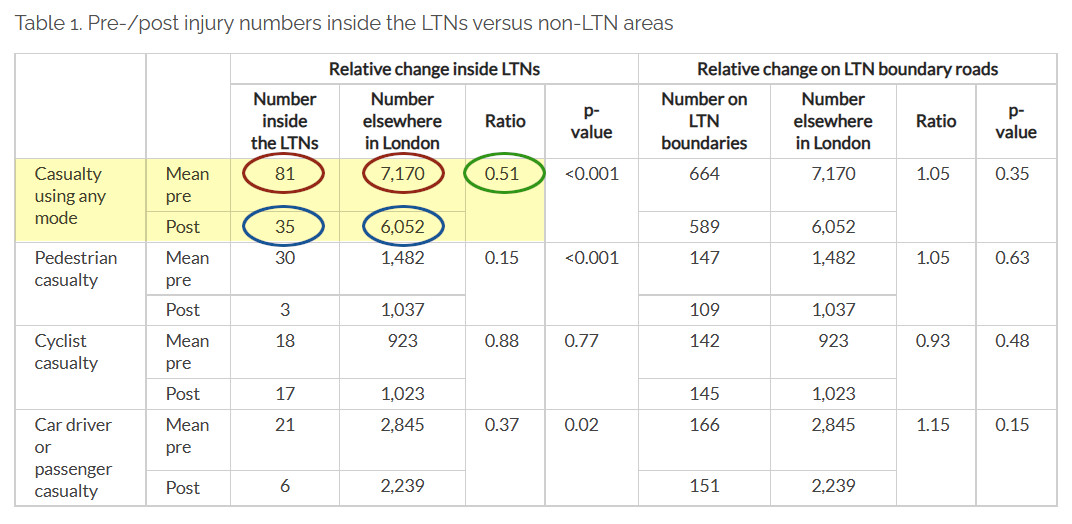
The reader will note we’ve circled a series of data points in red, blue and green.
The circle in green (0.51) represents the most important claim being made the Goodman Study – specifically, road injuries within districts which are now Low Traffic Neighbourhoods (relative to the rest of London) are only 51% of what they used to be prior to 2020. So how did Goodman and Aldred reach that number? Well, they used a form of computational modelling called statistical derivatives, that’s how.
- Calculation (A) - the red circles. Divide 81 by 7170 and multiply that by 100 to give the "PRE" percentage, 1.1297%.
- Calculation (B) - the blue circles. Divide 35 by 6052 and multiply that by 100 to give the "POST" percentage, 0.5119%.
And that’s it, that’s the logic used by the Goodman Study. It turns out Calculation (B) 0.5119% is only 51% of Calculation (A) 1.1297%, hence, in the world of Goodman and Aldred, this proves LTNs reduce road injuries by “50%.”
This is the point where we’d like to welcome you to the dodgy world of statistical derivatives. As Rachel Aldred herself later confessed in an online debate with well known social commentator Paul Lomax, “what we were comparing was the difference in the differences”. For the rest of this article we’ll refer to this dodgy form of computation as “the Goodman algorithm”, and by the end of this article we’ll have demonstrated how fundamentally flawed the Goodman algorithm truly is.
My colleague Rob Scott worked for many years as a data analyst in the investment banking industry. This is what he has to say about statistical derivatives, “They are dangerous things,” says Rob. “In the finance sector we’re trained to avoid them because they can be used all too easily to mislead investors into believing a trend is far more significant than it truly is. This is particularly true when you’re calculating derivatives from sample sizes which are super small relative to the larger data sets they come from.”
“There’s a general rule of thumb when using statistics and it’s this,” he continues. “If you want to give the impression a tiny sample size is undergoing a massive transformation, use statistical derivatives. If you want to give the impression a massive sample size is NOT undergoing any transformation AT ALL, again, use statistical derivatives.”
Part Three:- The Goodman Study is inherently flawed, and here's your proof.
The first thing worth noting is The Goodman Study of July 2021 is NOT a peer reviewed research paper. Far from it. For example, the data they claim was obtained from Police data files which shows latitude and longtitude coordinates for the road injury incidents? None of that is provided in the study, and quite frankly we don’t reckon it ever will be. But they did make a mistake – a really BIG mistake.
They provided a link to a zip file containing part of their supplementary information. And in that zip file was a .docx file which provided further detail regarding which boroughs did, and did NOT create new LTNs during the COVID lockdowns of March-September 2020.
Here’s a screenshot of what we’re talking about. We’ve highlighted the sections which are of interest to us in this article, in particular, check out the column titled “Number elsewhere in London”.
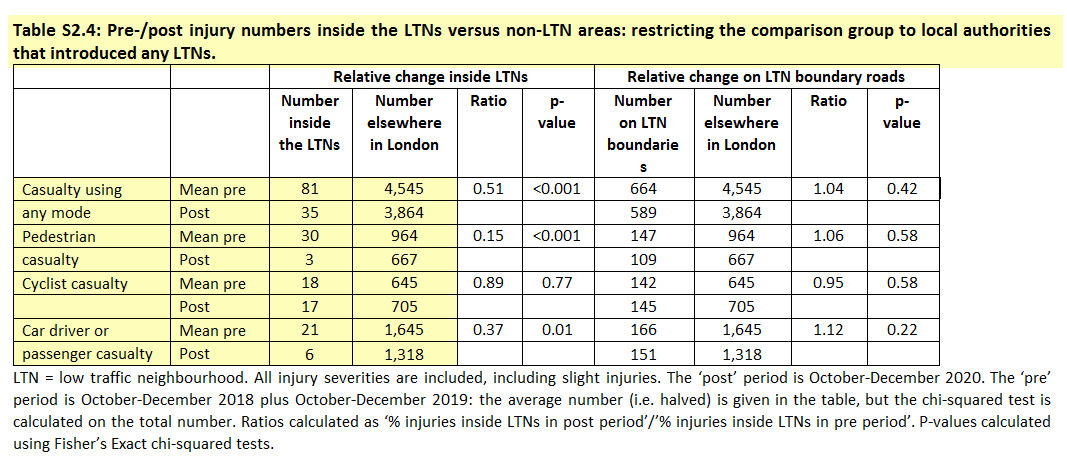
Keen eyes will note the same columns exist in an earlier table in Part Two of this article. The values in the column “Number inside the LTNs” are the same. The values in the column “Number elsewhere in London” are different. The difference being the first table (in Part Two of this article) contains the “before and after” data for ALL 32 boroughs. The second table (shown above) contains the “before and after” data for ONLY those boroughs which introdcued a new LTN during March-September 2020.
Hence, by subtracting the totals in Table S2.4 from the Table 1 in Part Two of this article we were able to create our own table which shows the exact totals for each category of road injury during Q4 in 2020 – specifically for those 10 boroughs which did NOT create an LTN during 2020. And here’s what it looks like. Here’s your proof The Goodman Study is little more than statistical propaganda.
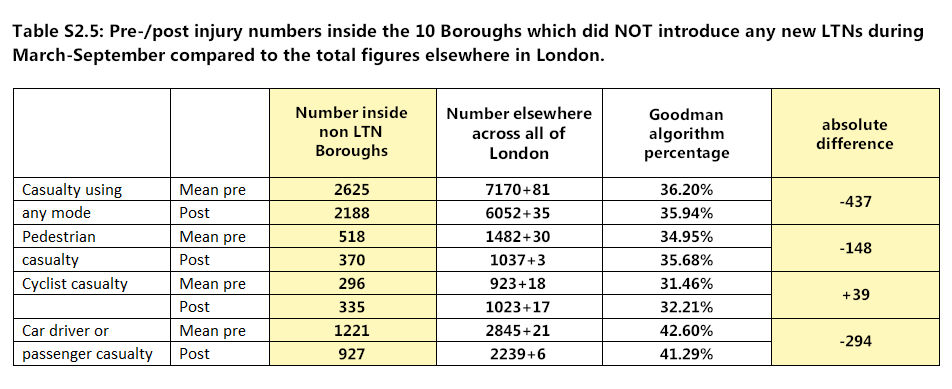
The reader will note in Table S2.5 (our table) we’ve created a column called “Number inside non LTN Boroughs”. This is where the rubber meets the road. In the 10 Boroughs which did NOT introduce LTNs during March-Sept 2020, those 10 Boroughs still had massive reductions in Q4 across every category – except cycling. We’ll touch on that later in this article.
- Total Road Injuries in the 10 non LTN Boroughs fell by 437 incidents, equal to a 16.6% drop.
- Pedestrian Injuries in the 10 non LTN Boroughs fell by 148 incidents, equal to a 28.6% drop.
- Vehicle Injuries in the 10 non LTN Boroughs fell by 294 incidents, equal to a 24.0% drop.
Let’s apply the Goodman algorithm to the row of data called “Casualty using any mode.” It’s a fact the total number of incidents fell by -437 incidents in Q4 of 2020 compared to Q4 in 2018-19. In total, that’s a very substantial -16.6% drop. We’ve used The Goodman Study’s own data to confirm this. However, the before percentage was 36.20% and the after percentage is 35.94%. According to the logic used in the Goodman algorithm – aka the difference in the differences – we saw a mere 0.7% drop in the non LTN boroughs “relative to the rest of London”. Perhaps you can now see just how flawed the Goodman algorithm truly is.
If the Goodman algorithm is such a valid method of measuring rates of change, why did it not reflect the massive drops in road injury statistics in the Boroughs which didn’t introduce new LTNs in 2020? After all, that’s what we’re doing here – we’re using the Goodman algorithm to analyse what happened in the 10 non LTN Boroughs “relative to the rest of London”. But it’s point blank failing, so why is that the case?
The answer is quite simple. The Goodman algorithm is inherently flawed – it only works on tiny sample sizes where small changes in incidents result in wild fluctuations in the statistical derivatives which suit their narrative. And this is VERY important as we’ll see in the next section of this article.
It’s appalling that this sort of research masquerading as “legitimate science” keeps getting the airtime that it does. Make no mistake, when Goodman and Aldred use statistical derivatives in their many regular “research study papers”, they know what they’re doing . They know how to play the game and they know who owns the hand that’s feeding them.
Part Four:- The Goodman Study knowingly uses a flawed algorithm specifically to pursue their agenda.
And what is that agenda? They want fewer cars on the streets, so they’re trying to justify something known as “frustration theory”. As noted earlier in this article, Low Traffic Neighbourhoods are wonderful things if you’re lucky enough to live in one, but they come with a price which everyone else has to pay for.
How does frustration theory work? Well, LTN’s make vehicle drivers super frustrated, and frustration theory suggests that people will reluctantly change their mode of travel if we make vehicle use so exasperating thay are left with no choice. To this end, creating yet more LTNs will help achieve that goal. And thus we get to the part of the Goodman Study which relates to the claim that no spill over occurred on roads and streets which form LTN boundary roads,
This is the part of the Goodman Study where they really showed what their agenda is. It’s where they dived feet first into the deep end of the Mayor’s current propaganda swimming pool.
We noted earlier that the 10 boroughs which did NOT introduce LTNs during 2020 still had massive drops in injury rates regardless, yet the Goodman algorithm showed no discernible percential change. So why did the Goodman Study use that algorithm?
The Goodman algorithm only works on tiny sample sizes, that’s WHY they used it. Think of it this way… imagine you’re interested in a data set which has 10,000 records, but a tiny sample size within that data set only has 5 records. We’ll refer to that tiny sub group as Sub Group (A). If that sub group grows by just one record, you can claim (quite falsely) that Sub Group (A) just grew by 20%.
However, if we’re focused on another Sub Group (B) which has 7,500 records and if Sub Group (B) grows by 10 records, according to the Goodman algorithm that’s statistically insignificant because Sub Group (B) only grew by 0.133% whereas Sub Group (A) grew by 20%, which in their world is more significant. And that, right there, is why the Goodman Study used the flawed Goodman algorithm.
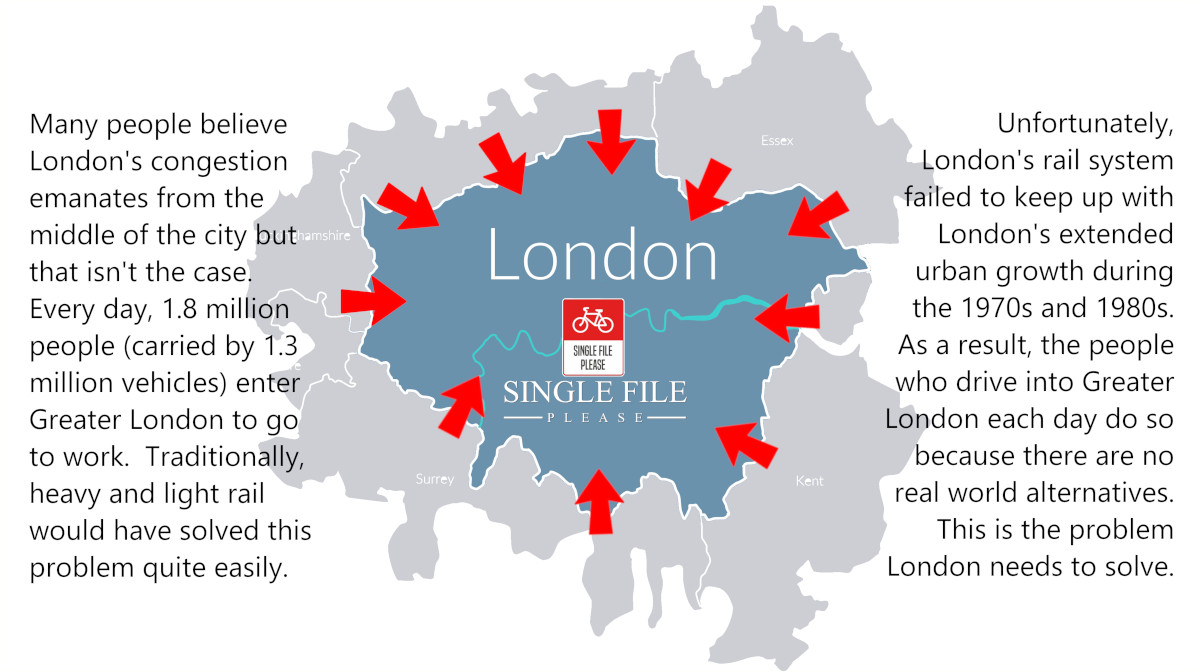
In Conclusion:- Where does the majority of London's road congestion actually come from?
As you might expect, London’s cycling lobby reckons LTNs are a great success because there are now fewer cars on at least 4% of London’s streets. From their perspective, anything that results in fewer cars on ANY street is a magnificent win.
But there’s a catch – the car traffic was supposed to evaporate due to ‘frustration theory’ – and it hasn’t. Far from it. The only thing that’s happened is traffic is now much MUCH heaver on the roads adjacent to the new LTN’s. Invariably it’s people at the lower socio-economic end of the spectrum who are paying the price in terms of increased pollution, increased noise, and increased danger.
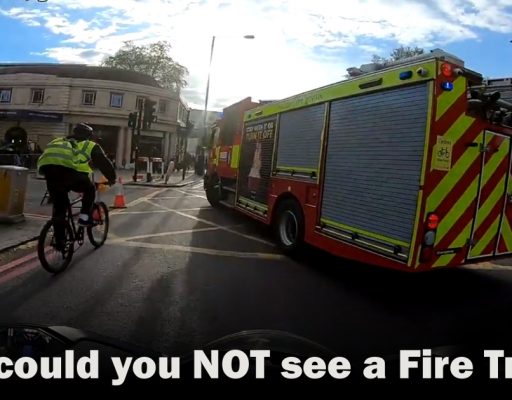
And that’s why this next meme is one of our most clicked on images.
Knowing full well that LTNs are incredibly unpopular, The Mayor’s Office has gone into propaganda overdrive. Instructions were sent to Transport for London to obtain specific research which shows LTNs are a great success. The Usual Suspects at the University of Westminster prompty produced the so-called research as requested, whereupon The Guardian (a newspaper which for all intents and purposes could be the official media channel for the cycling lobby) then printed the findings claiming “it was fully independant research”.
If you’d like you can read more about this recent “independant research” by clicking here.

Share this article on your favourite social media platform.